


Spotting Stock Risk Before It Hits The P&L: An Early Warning Framework for Merchandising Teams

More articles:
.png)







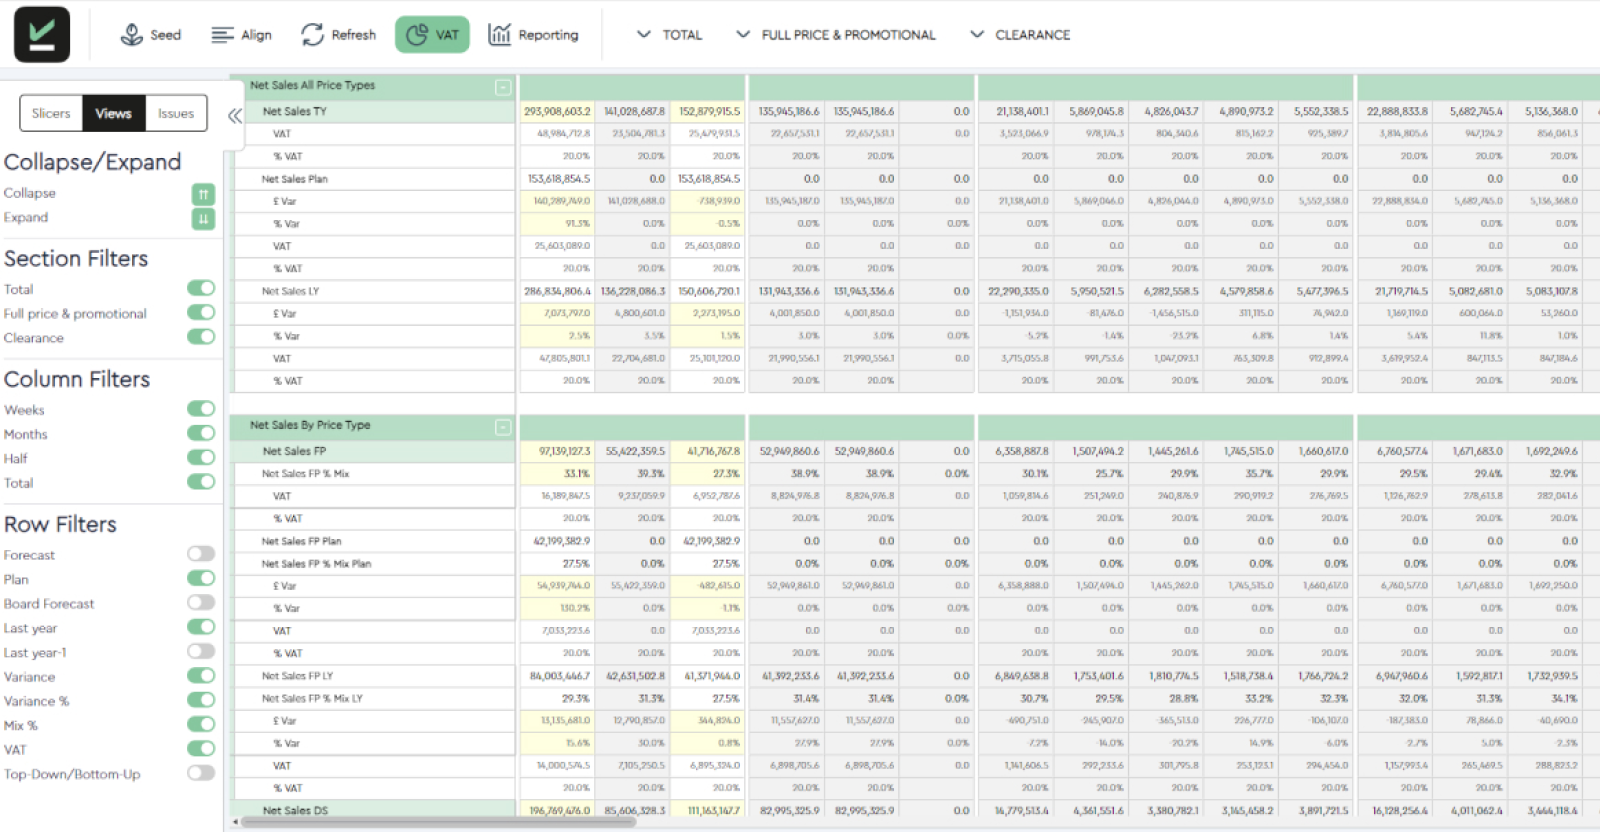


Picture a typical Monday inside a major apparel brand. The weekly trade meeting is wrapping up, and the team is feeling reasonably comfortable because the total sales numbers landed right on budget.
Beneath that reassuring aggregate figure, a very different story is unfolding quietly across the branch network. Three regional stores have completely run out of fast-moving core sizes, while two online warehouses are accumulating heavy stock that no one is buying. Because the high-level dashboard reports a healthy overall average, nobody flags the imbalance.
Three weeks later, those unmanaged extremes harden into urgent markdowns and severe availability gaps.
This is the practical challenge for merchandising directors, heads of merchandising and retail planning leaders working through a busy trading calendar. Historical sales and margin reports show what happened, but they fail to show what is coming next across products, stores, and channels.
This is where stock risk shows up first.
Retail stock management, done well, is the discipline of acting on that forward view rather than waiting for financial reporting to confirm the problem.
This framework sets out three forward signals, building on the kind of retail planning visibility that PlanIT Retail's wider work has already mapped out, along with a practical way to prioritise and act on them.
Key Takeaways
- Three forward signals: velocity drift, cover erosion and channel divergence, tend to move before stock risk shows up in margin or profit reporting.
- One signal moving alone is usually worth a review. Two or more moving together, consistent with the same cause, should trigger a structured intervention.
- The right action depends on the cause and the time remaining, not just the size of the variance.
- None of this replaces merchandising judgement. It gives the team a repeatable way to decide when that judgement needs applying.
Why Stock Risk Appears in the P&L Too Late
Margin and profit reporting summarises a period once it has closed. This makes it reliable for budgets and board updates but a poor tool for catching a problem while it is still developing.
Most inventory management in retail still relies heavily on this kind of periodic reporting, supplemented by dashboards that describe stock on hand rather than where it is heading.
Two limitations matter most. Aggregation lets a category or total figure look healthy while individual SKUs, stores or channels quietly move into overstock or availability risk. Delays in data mean that even good inventory tracking will not show falling stock cover or shifting demand until after it happens. By then, cheap solutions are off the table, leaving only costly ones: markdowns, stockouts, or writing off aged stock.
The Three Early Warning Signals of Stock Risk
Stock risk in retail tends toshow up first in three places:
- How fast something is selling against plan
- How much forward cover that pace of sale leaves
- Whether performance is consistent across thedifferent places a product is sold
PlanIT Retail's own commentary on early warning signs of stock risk makes a similar point: overstock and understock risk are usually visible in forward signals well before they erode margin.
The three signals below give that idea a repeatable structure: velocity drift, cover erosion and channel divergence.
Signal 1: Velocity Drift
Velocity drift is the gap between planned and actual rate of sale. A small week-to-week wobble is normal trading noise. What matters is a sustained deviation, several consecutive weeks moving the same way without an obvious explanation such as a promotion, a price change or a one-off event.
Faster than planned sale usually means intake and cover need reviewing before availability is lost. Slower than planned sale is often the earliest warning of retail markdown risk building later in the season. Drift also tends to show up at item level before it is visible at category level, which is why teams need item level stock management rather than waiting for a category trend to become obvious in a monthly report.
Signal 2: Cover Erosion
Cover erosion is the forward relationship between stock and demand moving out of an acceptable range faster than normal intake can correct. Weeks of cover only means something in context, against current demand, lead time, planned intake still to arrive, and where a product sits in its lifecycle.
Cover falling faster than expected, often alongside upward velocity drift, points toward an availability gap opening up. Cover building faster than expected, particularly late in a product's life, points toward aged stock and markdown exposure that grows the longer it goes unaddressed.
Avoid treating cover as a snapshot: a healthy figure today can still be wrong if the demand behind it has moved, or planned intake no longer matches the lifecycle stage.
Signal 3: Channel Divergence
Channel divergence is what happens when total performance looks stable while the channels underneath it move in opposite directions.
Store performance can weaken while ecommerce accelerates, or one region can build excess cover while another runs short, all while the blended figure stays close to plan.
That matters because divergence creates overstock and stockout risk at the same time, in the same product, just in different places. A team looking only at the total position has no reason to intervene, while a team looking by channel can often solve it through reallocation. This means moving stock to where demand actually is, rather thana markdown or an emergency reorder.
A Practical Framework for Retail Inventory Control
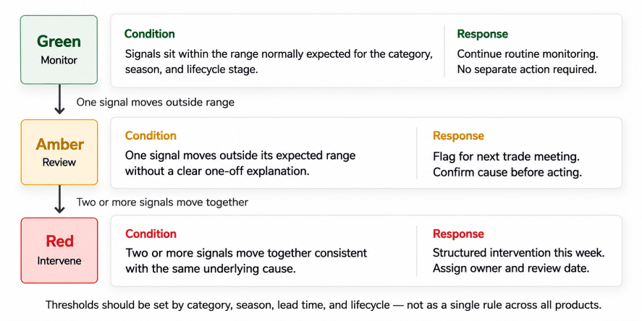
Not every drifting velocity figure or tightening cover position needs an immediate intervention. A simple Red, Amber, Green model helps teams separate normal movement from something needing a decision this week.
- Green covers movement within the expected range for that category, season and lifecycle stage.
- Amber covers a single signal moving outside its range, worth a review at the next trade meeting.
- Red covers two or more signals moving together toward the same cause, which is where a structured intervention should follow.
The thresholds behind each colour should be set by category, season, lead time and product lifecycle rather than applied as a single rule across the full range.
A fast fashion line and a core replenishment product will reasonably have different tolerances for velocity drift and cover erosion.
What Action Should Follow Each Risk Pattern?
The right response depends onwhat is causing the pattern and how much time is left to act, not just how fara figure has moved from plan. A handful of levers cover most situations:
- Reforecast cover against the latest demandsignal, not the original plan
- Amend or cancel upcoming intake where the demandshift is expected to hold
- Reallocate open to buy toward lines showingsustained upward drift
- Transfer stock between stores or channels wheredivergence, not total demand, is the issue
- Offer a substitution where availability riskcannot be closed in time
- Add targeted promotional support where cover isbuilding faster than demand
- Bring forward a markdown on a specific store, itemor channel rather than the full range
- Open a supplier conversation early where a leadtime change affects intake
Two or more can apply at once, particularly where channel divergence combines with drift or cover erosion. The decision matrix below maps common combinations to a starting point.
Decision Matrix
Embedding the Framework into Weekly Trading Cadence
A framework only earns its keep if it is used every week.
Give each signal a clear owner: velocity drift and channel divergence usually sit with the merchandiser closest to the category, while cover erosion often needs input from supply chain too.
Review the scorecard at a fixed point in the trading meeting, using an exception-based view that surfaces Amber and Red items rather than asking the team to scan every line.
Log the decision, not just the flag. A short note on cause, action and review date turns a one-off observation into a pattern the team can learn from and makes it easy to check later whether the action worked.
None of this works well from disconnected spreadsheets or a reporting stack that only shows historic performance. It depends on a forward view of sales and stock the whole team can see in one place, updated often enough that the scorecard reflects this week's trading.
Smarter Tools for Retail Inventory Tracking
To run this framework effectively, your system needs four key capabilities: a unified forward view of sales, stock, and intake; up-to-date, actionable data; aligned top-down and bottom-up planning; and flexible KPI tracking with scenario modelling.
PlanIT Retail is built around this kind of forward view. WSSI brings sales, stock, and intake forecasts into a single priority dashboard focused on high-impact decisions. Line Card adds item-level visibility, exception reporting, and AI-supported forecasts with automated OTB calculations.
Retailers using these solutions have reported greater visibility and inventory control as a direct result, alongside faster decisions. None of this replaces merchandising judgement; it simply gives teams the insight to act earlier, when costs are at their lowest.
Taking Action on Stock Risk
Stock risk is rarely invisible. It usually lives scattered across separate reports, reviewed too late, or spotted without a clear next step. Tracking velocity drift, cover erosion, and channel divergence gives merchandising teams a way to catch that risk while it is still an early warning signal, rather than a surprise in a monthly board pack. This framework does not replace judgment; it gives teams a clear weekly focus before P&L figures force their hand.
Managing stock risk becomes much easier when your team can see demand, forward cover, and channel performance in one place.
Contact the PlanIT Retail team for a personalised demonstration, or explore our Benefit Calculator to estimate the financial impact of improving inventory control.
Frequently Asked Questions
What is stock risk in retail?
Stock risk is the likelihood that current stock, relative to demand, will lead to a financial cost: lost sales from an availability gap, a markdown from excess stock, or working capital tied up in stock moving too slowly. It typically only becomes visible in the P&L after it has already affected the business.
Which metrics provide the earliest warning of overstock?
Forward stock cover measured against demand and lead time, combined with recent rate of sale trend, provides the earliest warning. A cover figure rising faster than the demand forecast justifies, particularly late in a product's lifecycle, is usually visible weeks before it affects margin.
How often should merchandising teams review stock risk?
Weekly, as part of the regular trading meeting, using an exception-based view rather than reviewing every line. Categories with shorter lifecycles or lead times may need closer attention during key trading periods.
What is the difference between stock cover and inventory turnover?
Stock cover measures how many weeks of demand current and incoming stock will support and is most useful as a forward-looking figure. Inventory turnover measures how many times stock is sold and replaced over a period and is typically a historic efficiency measure. Cover supports near term decisions, turnover helps assess longer term efficiency.
How can retailers reduce markdown risk without creating stockouts?
By catching cover erosion and velocity drift early enough to act through reforecasting, intake amendment or channel rebalancing, rather than waiting until a markdown is the only option left, and by checking channel divergence before assuming a change in total demand.
Can retail inventory tracking alone provide a forward view of risk?
Not on its own. It shows what stock exists and where it sits, but a forward view also needs a demand forecast, planned intake and lead times brought together, so the team can see where the position is heading rather than just where it is today.


Contact Us
If you’d like to request a demo or find out more about the products and services we offer, we’d love to hear from you. Leave your details in the form below and we’ll get back to you.